Absence reports


Absence reports |
|
Absence grid NSWAbsence grid NSW This report shows absences in the format required by the NSW DET for absence reporting.
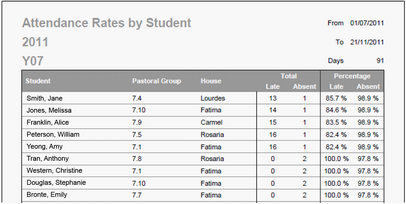
Absence – attendance rates This report will show you the total number of late records and absence records for each student, expressed as a number and also a percentage, over a date range specified by you. Students with the least number of absences and late records are at the top of the list. You are also able to print a list of students with no absences and no late records over the date range specified.
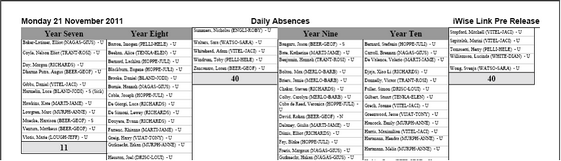
Absence Grid This report is the daily absences list. It shows all absences for today. The report parameter will allow you to specify a specific date.
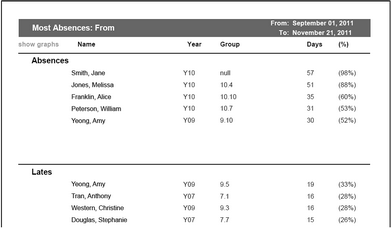
Absence Summary This report can be used to find the students with the most absences and late records over a specified date range.
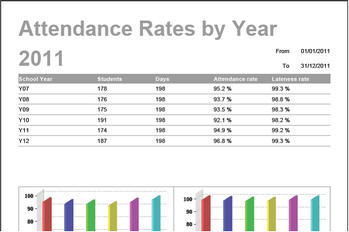
Absence Summary by Year This report will show you the attendance rate for each school year, over a specified date range, expressed as a percentage. It also graphs the attendance percentages.
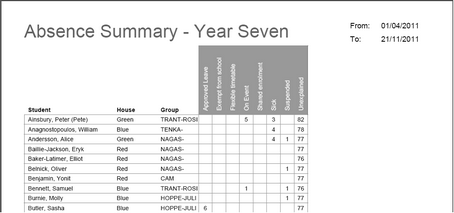
Absence Summary Grid This report will show you the total number of absence records, of each absence type, for each student, over a specified date range. The numbers are showing whole day absences only.
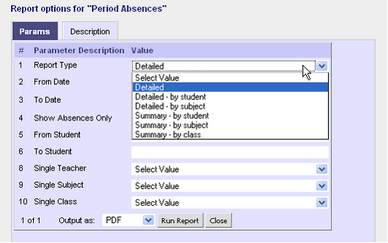
Period Absences There are a number of different reports available under the one Period Absences report:
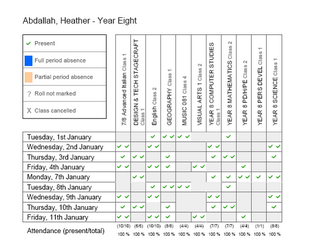
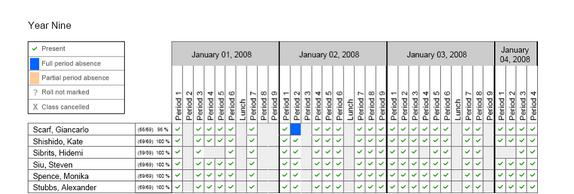
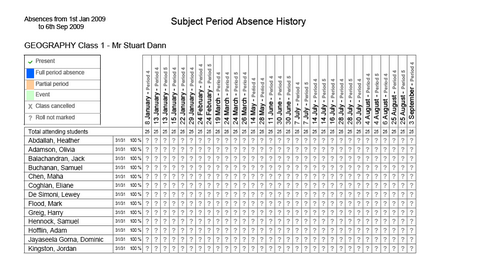
This report shows period attendance for a group of students, in all subjects, over a specified date range. The blue squares will easily show you students who have missed individual periods.
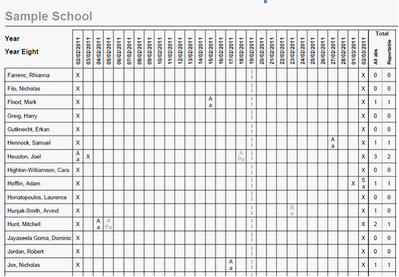
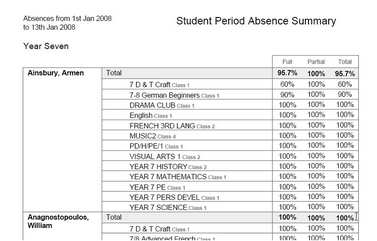
This report lists all subjects taken by students and, expressing as a percentage, shows how often a student was in class.
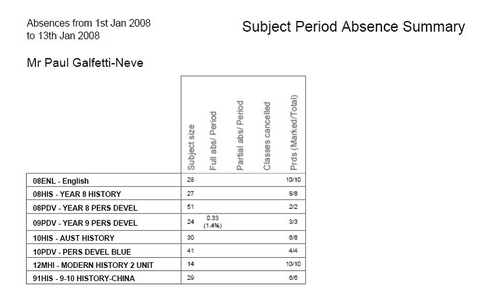
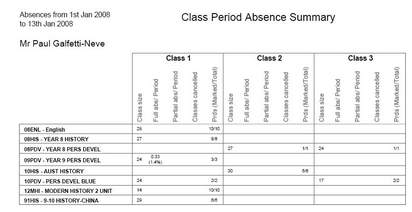
This report shows the subjects taught by individual teachers, the number of students in each subject and the percentage of students who have missed classes over a specified date range.
This report is similar to the one shown above, but lists classes rather than subjects.
This is the end of the description of the reports in the Period Attendance report.
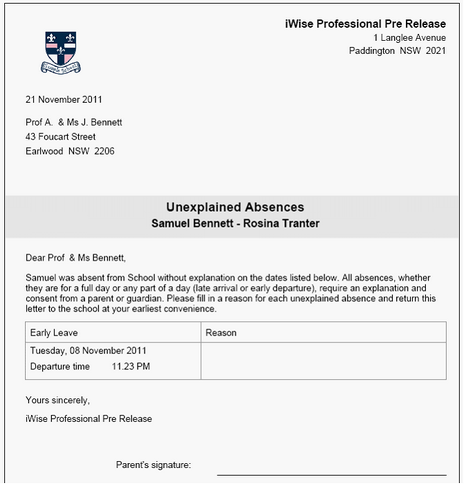
Unexplained Letter This report is a letter, designed to be sent to parents asking them to provide an explanation for their child’s unexplained absences, recorded over a date range specified by you.
This report shows absences in the format required by the NSW DET for absence reporting.
Absence – attendance rates This report will show you the total number of late records and absence records for each student, expressed as a number and also a percentage, over a date range specified by you. Students with the least number of absences and late records are at the top of the list. You are also able to print a list of students with no absences and no late records over the date range specified.
Absence Grid This report is the daily absences list. It shows all absences for today. The report parameter will allow you to specify a specific date.
Absence Summary This report can be used to find the students with the most absences and late records over a specified date range.
Absence Summary by Year This report will show you the attendance rate for each school year, over a specified date range, expressed as a percentage. It also graphs the attendance percentages.
Absence Summary Grid This report will show you the total number of absence records, of each absence type, for each student, over a specified date range. The numbers are showing whole day absences only.
Period Absences There are a number of different reports available under the one Period Absences report:
This report shows period attendance for a group of students, in all subjects, over a specified date range. The blue squares will easily show you students who have missed individual periods.
This report lists all subjects taken by students and, expressing as a percentage, shows how often a student was in class.
This report shows the subjects taught by individual teachers, the number of students in each subject and the percentage of students who have missed classes over a specified date range.
This report is similar to the one shown above, but lists classes rather than subjects.
This is the end of the description of the reports in the Period Attendance report.
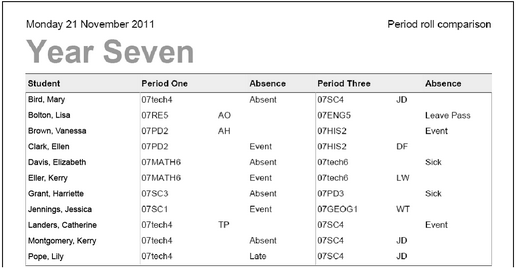
Period role comparison This report allows you to compare the attendance status of students between two selected periods. It is ideal for chasing up students who were in class in the first period but missing at the end of the day.
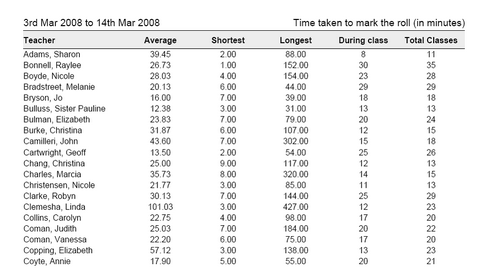
Roll Marking Stats This report lists teachers in alphabetical order and shows the average, shortest and longest time it took to mark their rolls, the total number of times it was done during class times and the total number of classes they had over a specified date range.
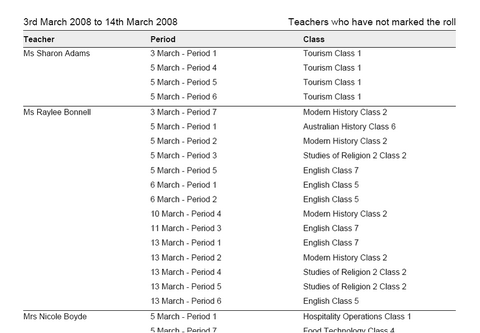
Rolls Not Marked This report shows a list of teachers and the rolls they have not marked over a specified date range.
Swipe in times This report provides the start time and class name for student’s first class of the day. This can be useful if you are allowing students to be absent from school until their first class.
|